History for "Reservation Density Report"
-
Updated by Megan Pastor, Aug 11, 2023 at 10:36am
Applies to Workplace, Coworking.
The Reservation Density Report can be used to find an hourly overview of how much your resources are being used within a certain timeframe. This can help you find out the busiest and leastbusiestbusy hours of the day for your resources.Navigate to Reports > Reservation Density.
- Select the year.
- Select the week.
- If you have more than one building or floor, you can filter by one or more of those options. (Workplace only)
- Select the resource type(s).
- (You can apply a resource type to your resources by navigating to Manage Reservations > Reservable Resources > Select the resource > Choose the resource type from the drop-down.)
- Select Run Report.
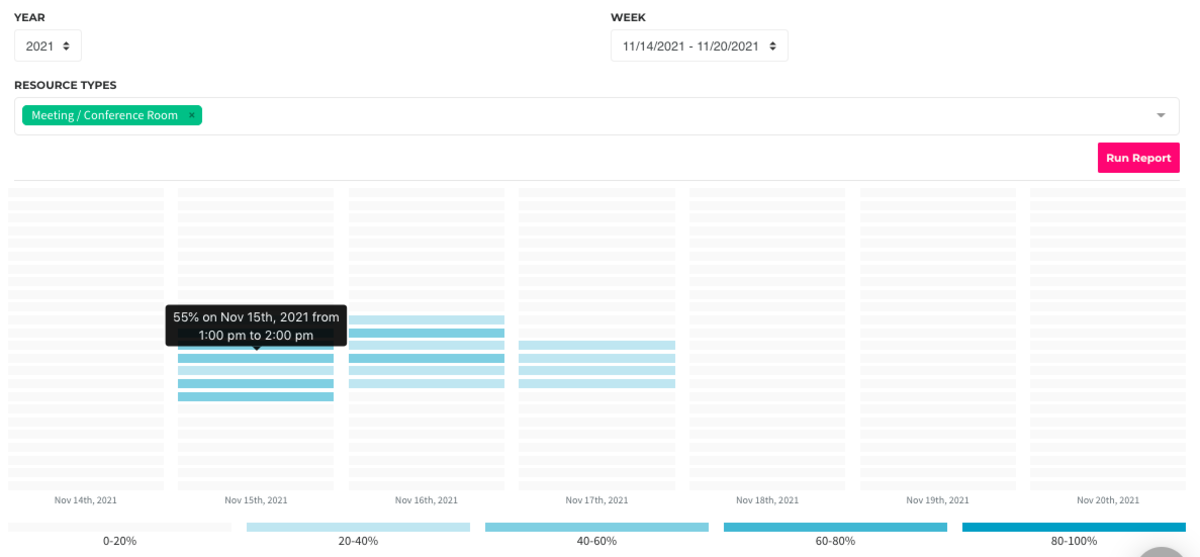
- The graph is split
in tointo columns with each column representing a day of the week. - Each day of the week has 24 rows which represent an hour out of the day.
- You can hover over each row to view the percentage of reservations that occurred within that time frame and resource type.
- The report can be downloaded as a CSV by selecting Download CSV in the top right corner.
-
Updated by allison blevins, Jul 08, 2023 at 4:30pm
Applies to Workplace, Coworking.
The Reservation Density Report can be used to find an hourly overview of how much your resources are being used within a certain timeframe. This can help you find out the busiest and least busiest hours of the day for your resources.Navigate to Reports > Reservation Density.
- Select the year.
- Select the week.
- If you have more than one building or floor, you can filter by one or more of those options.
(InventoryOnly)(Workplace only) - Select the resource type(s).
- (You can apply a resource type to your resources by navigating to Manage Reservations > Reservable Resources > Select the resource > Choose the resource type from the drop-down.)
- Select Run Report.
- The graph is split in to columns with each column representing a day of the week.
- Each day of the week has 24 rows which represent an hour out of the day.
- You can hover over each row to view the percentage of reservations that occurred within that time frame and resource type.
- The report can be downloaded as a CSV by selecting Download CSV in the top right corner.
-
Updated by Emma Reimer, Nov 16, 2021 at 3:01pm
20 -
Updated by Emma Reimer, Nov 16, 2021 at 3:01pm
The Reservation Density Report can be used to find an hourly overview of how much your resources are being used within a certain timeframe. This can help you find out the busiest and least busiest hours of the day for your resources.
Navigate to Reports > Reservation Density.
- Select the year.
- Select the week.
If you use the inventory management software and have buildings/floors defined for your space:- Select the building or floor.
- If you have more than one building or floor, you can filter by one or more of those options. (Inventory Only)
- Select the resource
typetype(s).(This is set by navigating to Manage Reservations > Reservable Resources > Select the resource.)- (You can apply a resource type to your resources by navigating to Manage Reservations > Reservable Resources > Select the resource > Choose the resource type from the drop-down.)
- Select Run Report.
- The graph is split in to columns with each column representing a day of the week.
- Each day of the week has 24 rows which represent an hour out of the day.
- You can hover over each row to view the percentage of reservations that occurred within that time frame and resource type.
- The report can be downloaded as a CSV by selecting Download CSV in the top right corner.
-
Updated by Emma Reimer, Nov 16, 2021 at 2:39pm
The Reservation Density Report can be used to find an hourly overview of how much your resources are being used within a certain timeframe. This can help you find out the busiest and least busiest hours of the day for your resources.
Navigate to Reports > Reservation Density.
- Select the year.
- Select the week.
- If you use the inventory management software and have buildings/floors defined for your space:
- Select the building or floor.
- Select the resource type. (This is set by navigating to Manage Reservations > Reservable Resources > Select the resource.)
- Select Run Report.
- The graph is split in to columns with each column representing a day of the week.
- Each day of the week has 24 rows which represent an hour out of the day.
- You can hover over each row to view the percentage of reservations that occurred within that time frame and resource type.
- The report can be downloaded as a CSV by selecting Download CSV in the top right corner.
-
Updated by Emma Reimer, Nov 15, 2021 at 3:14pm
The Reservation Density Report can be used to find an hourly overview of how much your resources are being used within a certain timeframe. This can help you find out the busiest and least busiest hours of the day for your resources.
Reservation Density ReportNavigate to Reports > Reservation Density.
- Select
-
Updated by Emma Reimer, Nov 15, 2021 at 2:38pm
tbdThe Reservation Density Report can be used to find an hourly overview of how much your resources are being used within a certain timeframe. This can help you find out the busiest and least busiest hours of the day for your resources.Reservation Density Report
Navigate to Reports > Reservation Density
-
Created by Emma Reimer, Nov 15, 2021 at 9:16am